Tech Debt Explained Like You’re 5
How to turn invisible liabilities into competitive advantage

Technical debt isn’t broken code. It’s borrowed time. Like financial leverage, it can fuel growth or destroy your company. This guide shows founders how to treat tech debt as a balance sheet item that shapes velocity, gross margins, and investor confidence.
The $400 Million Wake-Up Call
A large B2B company (documented in a McKinsey case study) spotted $2 billion in margin expansion opportunities. But when engineering ran the numbers, they discovered the real cost of execution would be $400 million. That forced them to abandon a quarter of their roadmap before a single feature shipped.
The issue wasn’t market conditions or aggressive competitors. It was accumulated technical debt. Shortcuts taken over the years had hardened into structural constraints. Two and a half years later, only half of the original initiatives had been delivered. The rest remained blocked by the weight of past decisions.
This isn’t rare. Most business transformations depend heavily on technology. Yet companies routinely spend 10 to 20 percent of their IT budgets servicing existing debt instead of building new value.
If you’re still treating tech debt as an internal engineering detail, this is the correction point.
Tech Debt for a 5-Year-Old: Why Your Treehouse Keeps Falling Apart
Imagine you’re building the best treehouse ever. You’re excited, so you cut a few corners. You skip leveling the floor. You use duct tape instead of screws. You finish the roof before the walls are solid.
At first, it works. Friends come over. You have fun. But every time you try to add something new, it takes longer than expected. The shaky foundation means you can’t just attach a slide. You have to prop up the whole wall first. The duct tape starts peeling, so you add more tape to hold the first batch in place.
Now you’re spending more time patching problems than building features. Your friends are upgrading their treehouses while you’re stuck reinforcing beams.
That’s technical debt. The structure isn’t broken. But everything you do takes more effort. The time you saved early on is now costing you in maintenance and delays.
What This Means for a 50-Year-Old Operator
Technical debt shows up in your financials whether you track it or not. Companies often spend 20 to 40 percent of their engineering budget on maintenance instead of building. That isn’t an engineering cost. That’s margin erosion.
Teams with high debt ship features about 50 percent slower. When delivery slips, sales can’t close based on roadmap promises. Developers report spending at least a quarter of their time dealing with past shortcuts. That drag compounds every quarter.
Debt also inflates cost per feature. What should take two weeks takes six. Your competitors with cleaner systems are spending less and moving faster. They’re winning on both speed and efficiency.
It also increases failure rates. Systems with high debt experience three to four times more production incidents. That hits reliability, customer trust, and retention. The more fragile your infrastructure, the more frequently users see the cracks.
Investors have noticed. Technical due diligence is now standard in later-stage rounds. High-debt startups often face valuation discounts of 15 to 30 percent because of execution risk. The numbers may look solid, but the hidden liability sits in your codebase.
While you spend 40 percent of engineering cycles on firefighting, a cleaner competitor is shipping faster, hiring happier engineers, and outpacing you on customer experience. Debt doesn’t just slow you down. It widens the gap between you and whoever’s moving faster.
Good vs. Bad Debt
Not all tech debt is harmful. The critical distinction is whether the debt was taken on deliberately, and whether it can be repaid. The best framework for this is a simple 2x2.
There’s deliberate debt and accidental debt. And there’s prudent debt and reckless debt. Good debt is deliberate and prudent. Bad debt is reckless, whether taken knowingly or not.
Good debt includes hardcoded shortcuts in an MVP to hit a launch deadline, with a plan to fix them later. Bad debt includes those same shortcuts left untouched two years later, patched repeatedly until a rewrite is unavoidable.
Inexperience also creates debt. So does learning. Your team might realize in hindsight that a different architecture would have scaled better. That’s still manageable debt if acknowledged early. It becomes dangerous only when it’s ignored or buried.
Taking on debt to hit market timing is valid. Refusing to track or service that debt is not. Most rewrites start as ignored to-do lists.
How to Measure It Using Business Impact
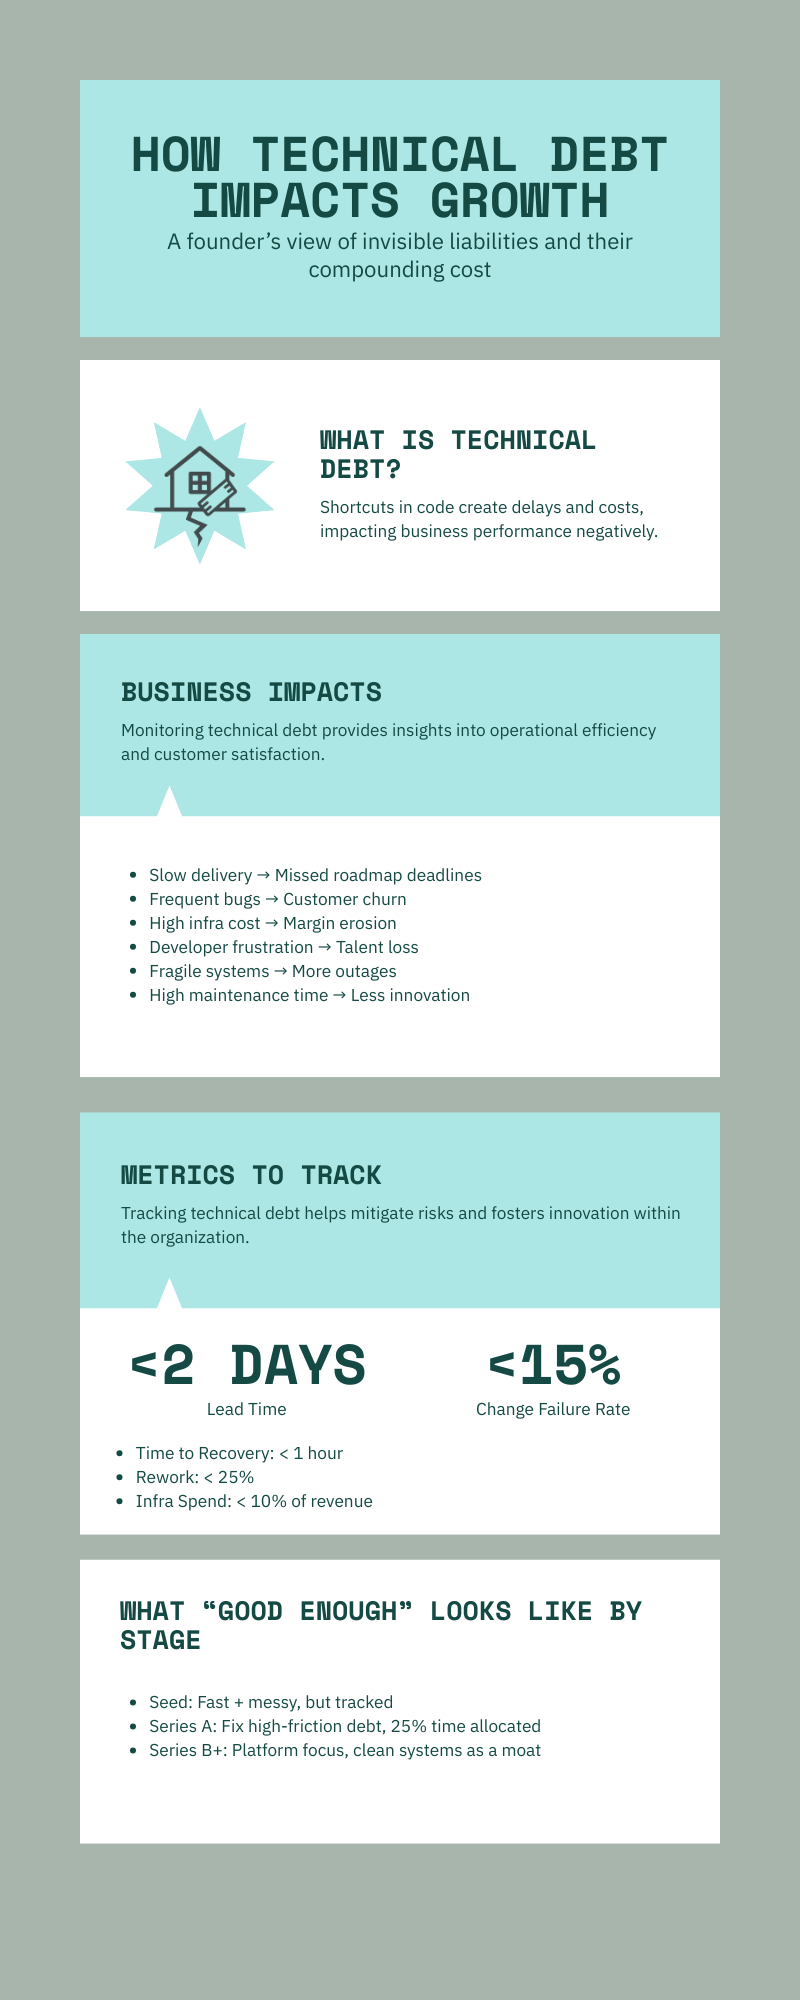
You don’t need to calculate code complexity to track technical debt. Measure its impact on speed, stability, cost, and quality. These metrics expose where debt is slowing you down.
Lead Time for Changes shows how quickly code goes from commit to production. Elite teams ship in under 48 hours. If it takes more than a week, your delivery pipeline is clogged.
Change Failure Rate reflects stability. Fewer than 15 percent of deployments should fail. Higher failure rates mean fragile systems and rushed fixes.
Mean Time to Recovery tracks how fast you restore service after an incident. Less than one hour is ideal. If you’re averaging more than a day, users are feeling the pain.
Defect Escape Rate reveals product quality. Low-debt teams catch bugs in testing. High-debt teams ship them to customers.
Rework Percentage shows how much of your sprint is wasted. More than 40 percent of time spent fixing instead of building is a red flag. Elite teams stay under 20 percent.
Infrastructure Cost Growth should stay proportional to revenue. If your infra spend rises faster than growth, something’s broken.
Incident Frequency measures fire drills. A stable team handles fewer than one urgent incident per month. More than one per week signals deeper problems.
Start by tracking just three: lead time, failure rate, and rework. You’ll quickly see where you’re bleeding time and money.
Stage-Based Playbooks
At seed stage, debt is a tool. Speed matters more than perfection. You can tolerate higher failure rates and longer lead times as long as you’re learning fast. What matters is keeping track of what you break and having the discipline to fix it later.
By Series A, you need predictability. Investors expect reliable delivery. Customers expect fewer bugs. This is the phase where untracked shortcuts begin to hurt. Start paying them down. Allocate 25 percent of engineering time to maintenance. Use error budgets to enforce quality without killing momentum.
At Series B and beyond, technical excellence becomes a moat. Your system should support fast iteration without regressions. The cost of downtime or slow delivery is too high. Architecture needs governance. Developer onboarding needs standards. Platform teams should exist to keep core systems clean and fast.
Debt never disappears on its own. It accumulates quietly until it blocks growth. The best companies don’t avoid debt. They manage it like capital.
Three Experiments to Reduce Debt Without Pausing Delivery
Run a Debt Sprint. In the first week, identify five high-impact, low-effort debt items. Pick things that slow down common workflows or block features. In the second week, fix only those. Measure lead time and defect rate before and after. Expect a 10 to 20 percent speed increase. It’s often the first proof founders need to invest more seriously.
Use Error Budgets. Start by defining service levels for critical user actions. Set a reliability target, like 99.9 percent uptime. That gives you a monthly error budget of around 43 minutes. If your system exceeds it, pause new feature development and focus on stability until you’re back on track. This creates a clear rule for trading speed for quality.
Document a Golden Path. Choose a common development task, like adding a new API endpoint. Write down every step, tool, and convention. In week two, create a template that automates this flow. The goal is to make the best practice also the fastest path. This reduces variation, onboarding time, and decision fatigue.
None of these experiments require rewrites. They create structure, clarity, and momentum without slowing the business.
Reporting Tech Debt to the Board
Treat technical debt as a balance sheet item. Frame it in terms of engineering time, business delays, and capital efficiency. Use metrics your board already understands.
Summarize with one slide.
Current Load: Percent of engineering time spent on maintenance.
Trend: Is it going up, down, or flat over the last 3 months?
Impact: How many weeks of delay is this causing on roadmap features?
Investment Required: How many engineer-weeks to hit target load?
ROI Projection: What speed or margin gain do you expect post-investment?
Track leading indicators like story points delivered, recovery time, defect rates, and infra costs. Show how each one improves as debt is paid down. Make technical health part of your regular reporting, not a one-off crisis.
When debt is invisible, it gets ignored. When it’s presented like cost, delay, or margin loss, it gets resourced.
Common Failure Patterns to Avoid
All-or-Nothing Thinking. Some teams ignore debt until it explodes, then propose full rewrites. Both are wrong. The smarter approach is incremental replacement. Use the strangler pattern to carve out one part of the system at a time while the rest stays live. Clean as you go. Don’t pause the business.
False Engineering vs Business Divide. Founders often hear engineering say “we need to fix everything” while sales says “we need to ship now.” This tension is normal. Align both sides around shared metrics. If an outage delays a deal, both teams lose. Use numbers to replace opinions.
Shaming Past Decisions. Don’t moralize. Most shortcuts were rational at the time. Maybe you needed to hit a funding milestone. Maybe the right architecture wasn’t obvious. The real mistake is refusing to acknowledge debt now. Blame wastes time. Focus on what to fix next.
Perfectionism. Trying to eliminate all debt is just another form of procrastination. Even elite teams carry some debt. The goal isn’t purity. It’s control. If you’re spending more than 25 percent of time on maintenance, reduce it. If you’re spending less than 15, you might be over-optimizing.
Try reframing your next retrospective. Start with: “What shortcuts helped us move fast?” Then ask: “Which ones are now slowing us down?” That shift creates permission to improve without blame.
30-Day Action Plan
Week 1: Set the Baseline
Start by collecting key metrics. Instrument lead time, failure rate, and recovery time using tools you already have. Survey the team about pain points and time allocation. Create a simple debt register listing known shortcuts and rough fix costs.
Week 2: Fix the Obvious
Pick three debt items that are easy to fix but cause frequent friction. Clean them up. Set basic error budgets for your most critical services. Document one golden path that every developer should follow for a common task.
Week 3: Make the Case
Analyze the business impact of debt using your new metrics. How much time are you losing per sprint? What’s the delay on key features? Build a simple roadmap of fixes and forecast the gains. Prepare one slide for your leadership team or board showing cost, timeline, and ROI.
Week 4: Build Momentum
Run a focused sprint targeting one area of debt. Train the team on new workflows or processes. Measure results at the end of the week. If velocity improves, scale the effort. If not, adjust priorities.
This plan keeps delivery going while proving the business case for deeper investment.
Checklist: What Operational Maturity Looks Like
Visibility
Metrics are collected and reviewed monthly
Debt register exists and is updated
Maintenance time is tracked and under control
Dashboards show trends and impact
Governance
Architecture decisions are reviewed
Error budgets guide prioritization
A consistent slice of time is reserved for debt work
Escalation paths exist when debt blocks customer outcomes
Communication
Debt is framed as cost and delay, not code quality
Business and engineering speak the same language
Debt is discussed in planning, not emergencies
Progress is reported in investor updates
Execution
Roadmap includes debt reduction
Golden paths are documented and used
Fixes are incremental, not rewrites
Teams know what “good enough” looks like